To begin with, you need to download MSChart.exe, and you will also find life a lot easier if you install the Visual Studio Add on that adds the charting control to the toolbox and offers Intellisense support for the components too, and also download the .chm documentation. There are also a load of samples showing the charts being used against a variety of data ssources, such as xml, csv, Excel and a typed dataset. These can be downloaded from http://code.msdn.microsoft.com/mschart.
Once you have installed the .exe and the VS Add on, you will see a chart icon in the Data section of the Toolbox in Visual Studio, but if you are using Visual Web Developer Express, you will need to add it manually. This can be done by right-clicking on the Data section header, and choosing Add Items.

From there, select the System.Web.UI.DataVisualization.Charting flavour of Chart, and click OK.

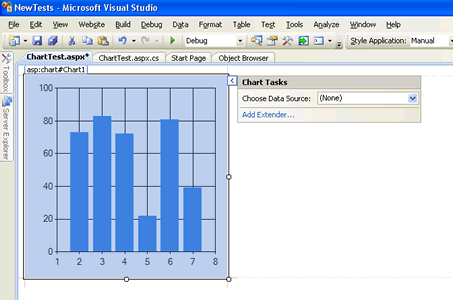
That's it. The Chart icon should appear in your toolbox, ready to be dragged onto the Forms Designer. Once you do, you are presented with a default vertical bar chart.
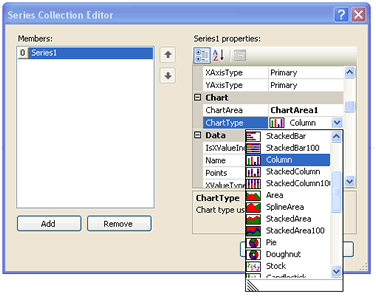
To change the chart type, you need to find the Series option in the Properties panel for the Chart. If you click next to (Collection) a button with ellipses will show, and clicking on this will reveal the Series Collection Editor. In the Chart section, you will find Chart Type, and a drop down offering you a selection to choose from. I chose Pie.
There are a huge number of options available to format the chart. These are found in the Chart section of the Properties, and are generally members of collections. ChartArea options include the ability to set a 3D appearance, inclination etc of the actual chart; Legends and Title allow you finer control over these areas, and Series holds one of the most important options (in the Data Source section): XValueMember and YValueMembers. These must be set to bind data to the chart, and to prevent a blank image being rendered.
I drag a SqlDataSource onto the designer, and configure it to connect to an old copy of this site's database, and apply the following SQL to it:
SELECT Categories.Category, COUNT(ArticleCategories.CategoryID) AS TotalInCategory
FROM ArticleCategories
INNER JOIN Categories ON ArticleCategories.CategoryID = Categories.CategoryID
GROUP BY Categories.Category
This produces a resultset that shows how many articles there were in each category on my site during stage 2 of its evolution. Having done that, click the smart tag on the chart, and choose the datasource. At this point you can normally run the page if this was a GridView or similar databound control, but if you do, the result would be a totally blank page. Now you need to go back to the Properties panel, and find the Series section and configure the XValueMember and the YValueMembers as mentioned previously. Fortunately, the two values that are being returned are available as dropdown options.
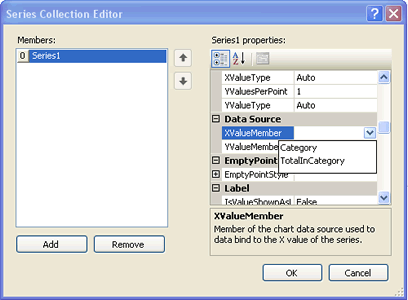
I select Category for the X value, and TotalInCategory for the Y values, and run the page:
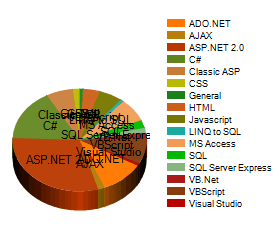
The result is far from satisfactory, so I fiddle with some more of the formatting properties and the size and get something much nicer:
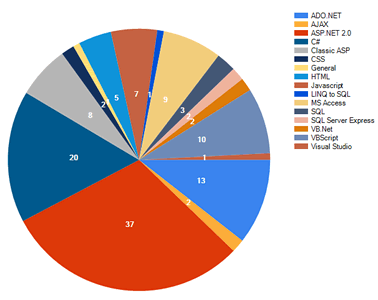
The charts are rendered as images. The default is to use an HttpHandler to stream the image to the browser as a png file - all managed by the Chart library. However, there are options to change the image type to jpg, bmp or emf files and to save them to the filesystem and use a straightforward <img> tag to show them. The documentation is quite comprehensive in its coverage of the library classes etc, but is very disappointing in its lack of walkthroughs or easier explanations or notes as to what each property does, and what effect changing it might have on the resulting graph. However, there is already a forum dedicated to the chart control library at MSDN forums, and no doubt most beginner questions will be answered there as it grows.
