Prefix is developed by a company called Stackify, who also do some heavy-weight application performance monitoring kit. The Prefix download is a standard msi so it is easy to install, and once installed, it runs in the background and is available from the system tray.
Prefix uses a browser for its UI. When you click on the system tray icon, the notification lets you know that it is waiting for new web requests to profile.
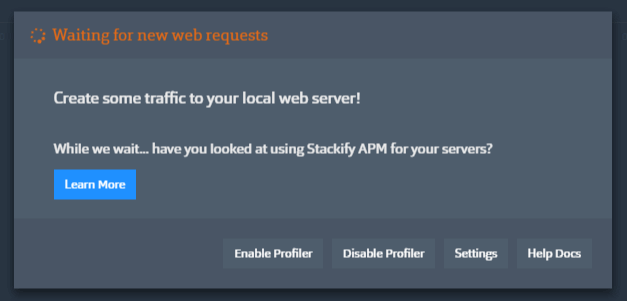
It is not immediately clear whether the profiler has been enabled as both the Enable Profiler and Disable Profiler buttons appear in the same indeterminate state. However, as soon as you fire an application up in IIS Express, you can see whether it is being profiled:
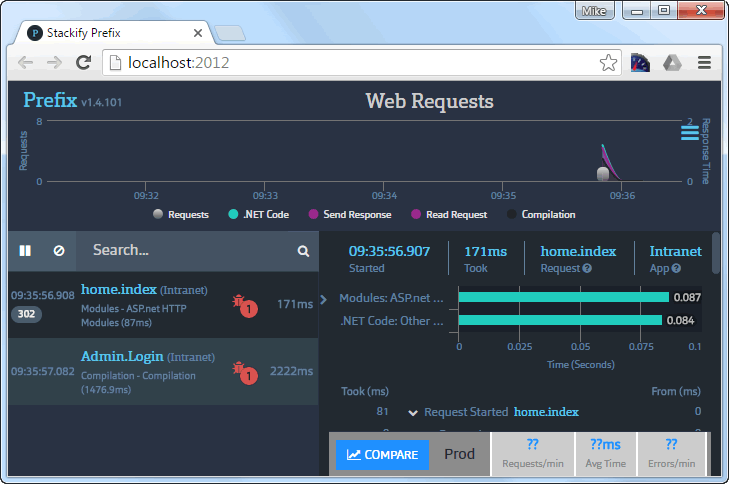
Each individual request is monitored. In the image above, you can see an Intranet application being started. The default home page is initially requested, and the response is a 302 redirect to the login page. This happens to be an MVC application, but Prefix works with Web Forms and Razor Web Pages applications just as well. ASP.NET Core support is coming soon, we are promised.
The left hand side of the screen shows each request, with the time it took, the response status, the number of database calls the request required and the number of uncaught exceptions (if any).

The right hand side of the screen allows you to drill down into the detail of each request. For example you can examine the request headers:
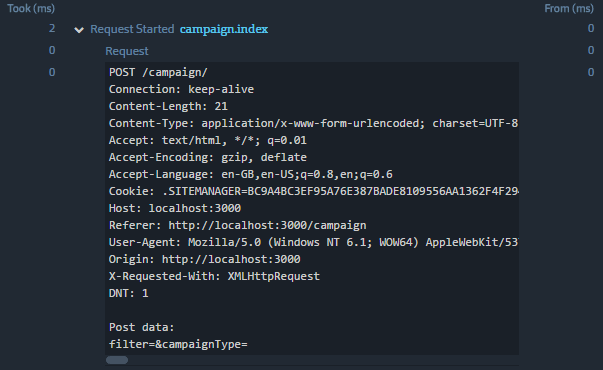
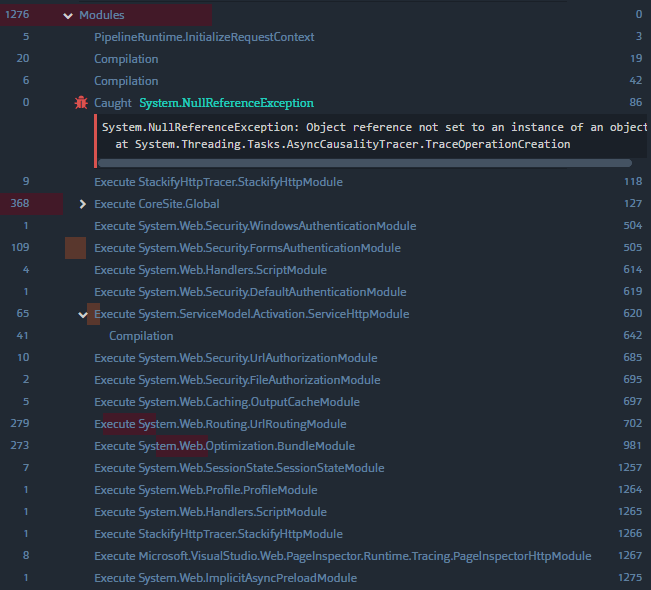
You can get this type of detail from any browser extension, but what you can't get from there is a breakdown of the compilation time and the modules and handlers in the request pipeline such as the following example that features a request to a Web Forms application:
You also get a visual breakdown of what resources are being used most during page execution:
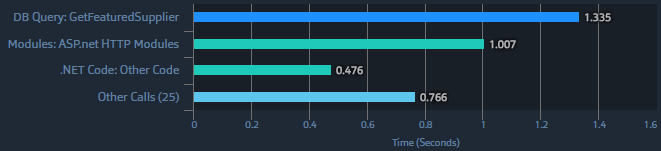
Prefix captures the command text that's executed against the database. In the image above, you can see a stored procedure called GetFeaturedSupplier taking 1.335 seconds to execute. At the moment, it doesn't monitor parameter values, but that feature is being added. Being able to see the command text is particularly useful if you are using Entity Framework because you can you examine the generated SQL easily:
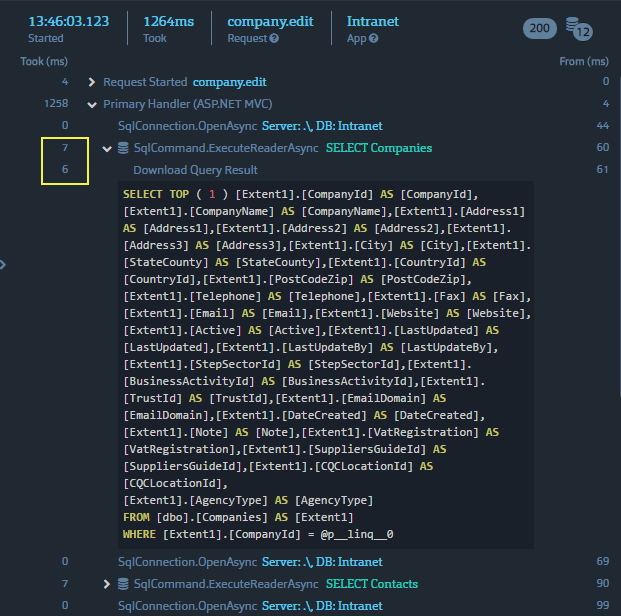
A nice feature is the Download Query Result counter (in the yellow box above), which tells you how much of the database call time was used for transferring the resulting data, as opposed to executing the actual query.
The details pane shows particularly expensive operations with a different colour background:
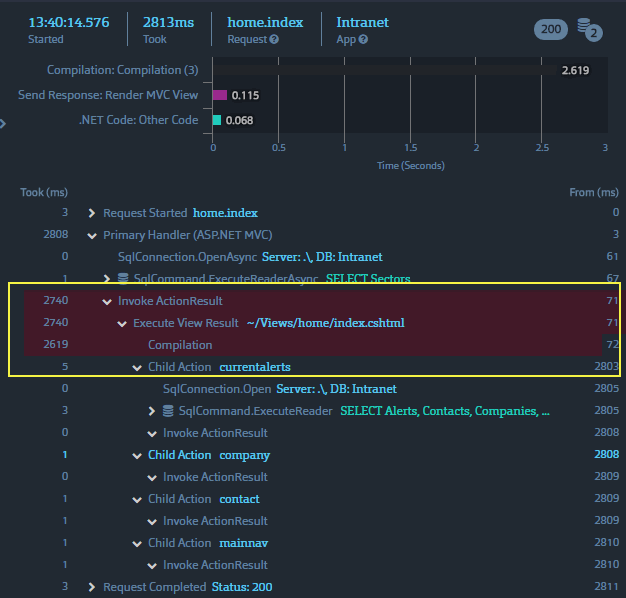
In this particular case, the view compilation took most time. While that's a one-off cost, it could be worth considering precomiling the views. The point is that Prefix details exactly what it is that you should be focusing on to improve performance.
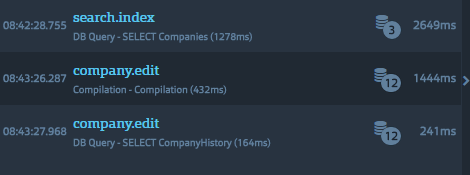
As to the bugs that Prefix helped me identify, one was the same stored procedure being called twice in the same page in a Web Forms application. This was caused by the fact that I had changed some code to explicitly call the Select method of a SqlDataSource control in code behind while the control was still bound to a ListView, resulting in the Select method being fired twice. The other bug was an Action being fired twice in quick succession (which wasn't noticeable in production) resulting in an unnecessary extra 12 calls to the database:
On closer examination, it was clear from the request headers that the second request was being initiated by AJAX. The culprit was a mistake in some jQuery code, where AJAX caching was incorrectly configured as follows:
$.ajax({ cache: false });
instead of
$.ajaxSetup({ cache: false });
The original code will of course result in an asynchronous call being generated.
Summary
Prefix is a very useful tool for seeing exactly what is going on within your ASP.NET application during development. It is extremely lightweight and is easily accessible from the system tray. It will help you identify any potential processing bottlenecks, as well as hidden bugs. It's definitely become part of my toolkit.
